| Matrix Display |
The default display is the Matrix View. This view displays the selected content of each event block uniformly, with links showing the flow of the actions toward the outcome, and any comments or questions about the flow or EB.
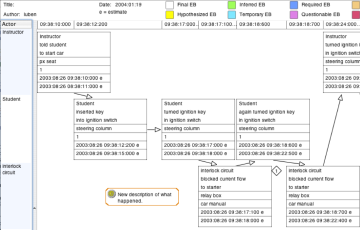
In this view, the objective is to look at each EB, link and EB pair or set on the Matrix as a candidate problem, hazard, risk raiser, need or impediment that, if changed, could improve future performance.
- A problem exists when, for example, the EB, link, pair or set describes a behavior that is not desired, unexpected, different that expected, objectionable, out of sequence, in conflict with another behavior, excessive, insufficient or sub-optimum.
- A hazard exists when, for example, the EB, link, pair or set could, when combined with another behavior, initiate, contribute to or sustain a harm-producing scenario.
- A risk raiser exists when, for example, the EB, link, pair or set has the inherent potential for initiating, contributing to or sustaining an undesired scenario if not executed with perfection each time it occurs.
- A need exists when, for example, the behavior leads to subsequent inefficient, ineffective or sub-optimum downstream behaviors in the process.
- An impediment exists when, for example, a behavior actually interferes with subsequent behaviors, diminishing process performance.
While not mutually exclusive, these examples illustrate the kind of thinking required when examining the EB flows on the Matrix.
|
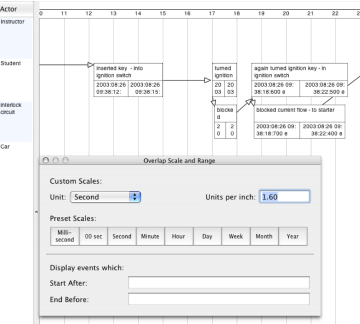
| Overlap Display |
The Overlap View is an alternative display of selected EBs on the time/actor matrix. This view presents actions and their begin and end date/time data in their sequential order but in an elongated EBs whose length is proportional to the EB duration. EBs are displayed as parallel "bars" on the matrix. Use this view to see the time relationships among overlapping actions.
In this view, the objective is to examine overlapping EBs to determine if the overlapping behaviors can be the source of a candidate problem, hazard, risk-raiser, need or impediment. The view enables analysts to determine - the reasonableness of the estimated times assigned the selected EBs when viewed next to each other, particularly when the times are not reported observations.
- workloads imposed on people or equipment where time to act may be constrained by the system design or configuration. For example, operator workloads imposed by control room or display designs can be documented to examine the feasibility of the demands imposed on operators during various assumed or experienced incidents.
Rearrange the order of the actor rows, and adjust the scale if needed, to display overlapping EBs adjacent to each other during the analysis task.
Adjust the begin and end date/time data by simply dragging the left or right edge of the EB to the desired new start or end time.
TIP: An alternative way to review and edit any begin or end times for EBs displayed in the Overlap View is with the EB Panel, which shows the begin and end dates and times for each EB in tabular form. Another alternative is to use the Inspector where the duration can be entered directly.
Add EBs if needed in this view.
When a problem is found in this Overlap view,- select the EB where the problem exists
- Switch to the Matrix View
- attach a Diamond to the EB, as described in the next page.
|
