 |
INVESTIGATION CATALYST Recommendation Development Tutorial © 2004 by Starline Software Ltd. |
|
PROBLEM ASSESSMENT
After identifying all the problems, you need to decide if each problem is worth fixing. General ConsiderationsThat task requires application of assessment criteria to rank the significance of the candidate problems. The criteria vary with the type of occurrence and purposes of an investigation or analysis. Thus they have to be developed by each organization performing investigations or analyses. Investigation Catalyst offers default measures for users who do not have their own measures. The recommendation development process should separate those worth fixing from those you can afford to live with. Focus on the problems you select to fix. Usually this decision is heavily influenced by the extent of the likely consequences, such as future performance or outcomes if the problem is not fixed. This can be aided by using an assessment tool for arraying all the criteria and assigning values to the problem for each criterion, as in the matrix below. Evaluation CriteriaThe first task is to select evaluation criteria. This task is dependent on the practices of the organization sponsoring the project. The application provides default fields, which users can use as is, or rename and enter their own assessment measures. |
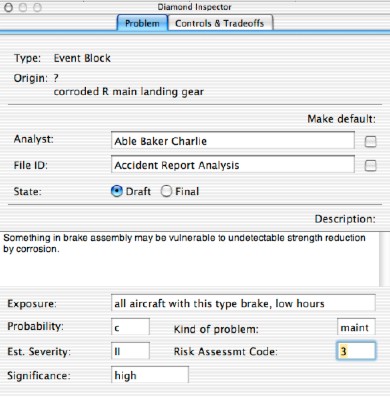
The defaults shown in the lower portion of this Panel include entries to:
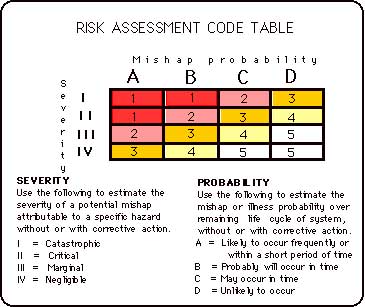
Sample rating toolOne tool for developing ratings is to use a matrix with 16-20 cells, with coordinates representing considerations of interest listed in some descending value or significance. Users can create a matrix with a spread sheet application and use it to develop these assessments, or they can use published matrixes. In the safety field, for example, a Risk Assessment Code matrix, shown below, illustrates the format of this kind of assessment matrix. In this example, the considerations are the frequency and severity of potential loss effects, represented by four severity levels and four probability levels. I and A are the greatest severity and highest probability of a potential loss, and thus the most undesirable effects or risks. The entries in the table represent the weight to be given that risk level for ranking the priority for fixing it. |
|
To use the table, for a future activity (exposure) make a judgment or get a consensus about the anticipated probability of a future incident, and its likely severity or range of severities. (In this matrix, marginal may be replaced by serious or two descriptors to modify the severity scale.) If desired, relabel the entries to reflect the current value systems of the organization. |
| Previous | Next | Tutorials Menu |